|
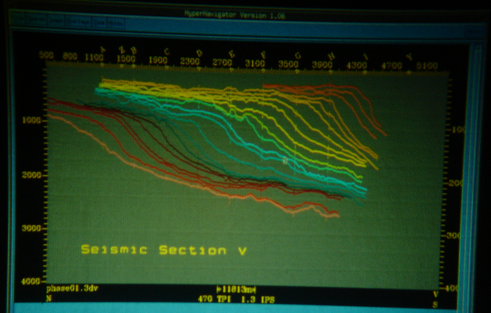
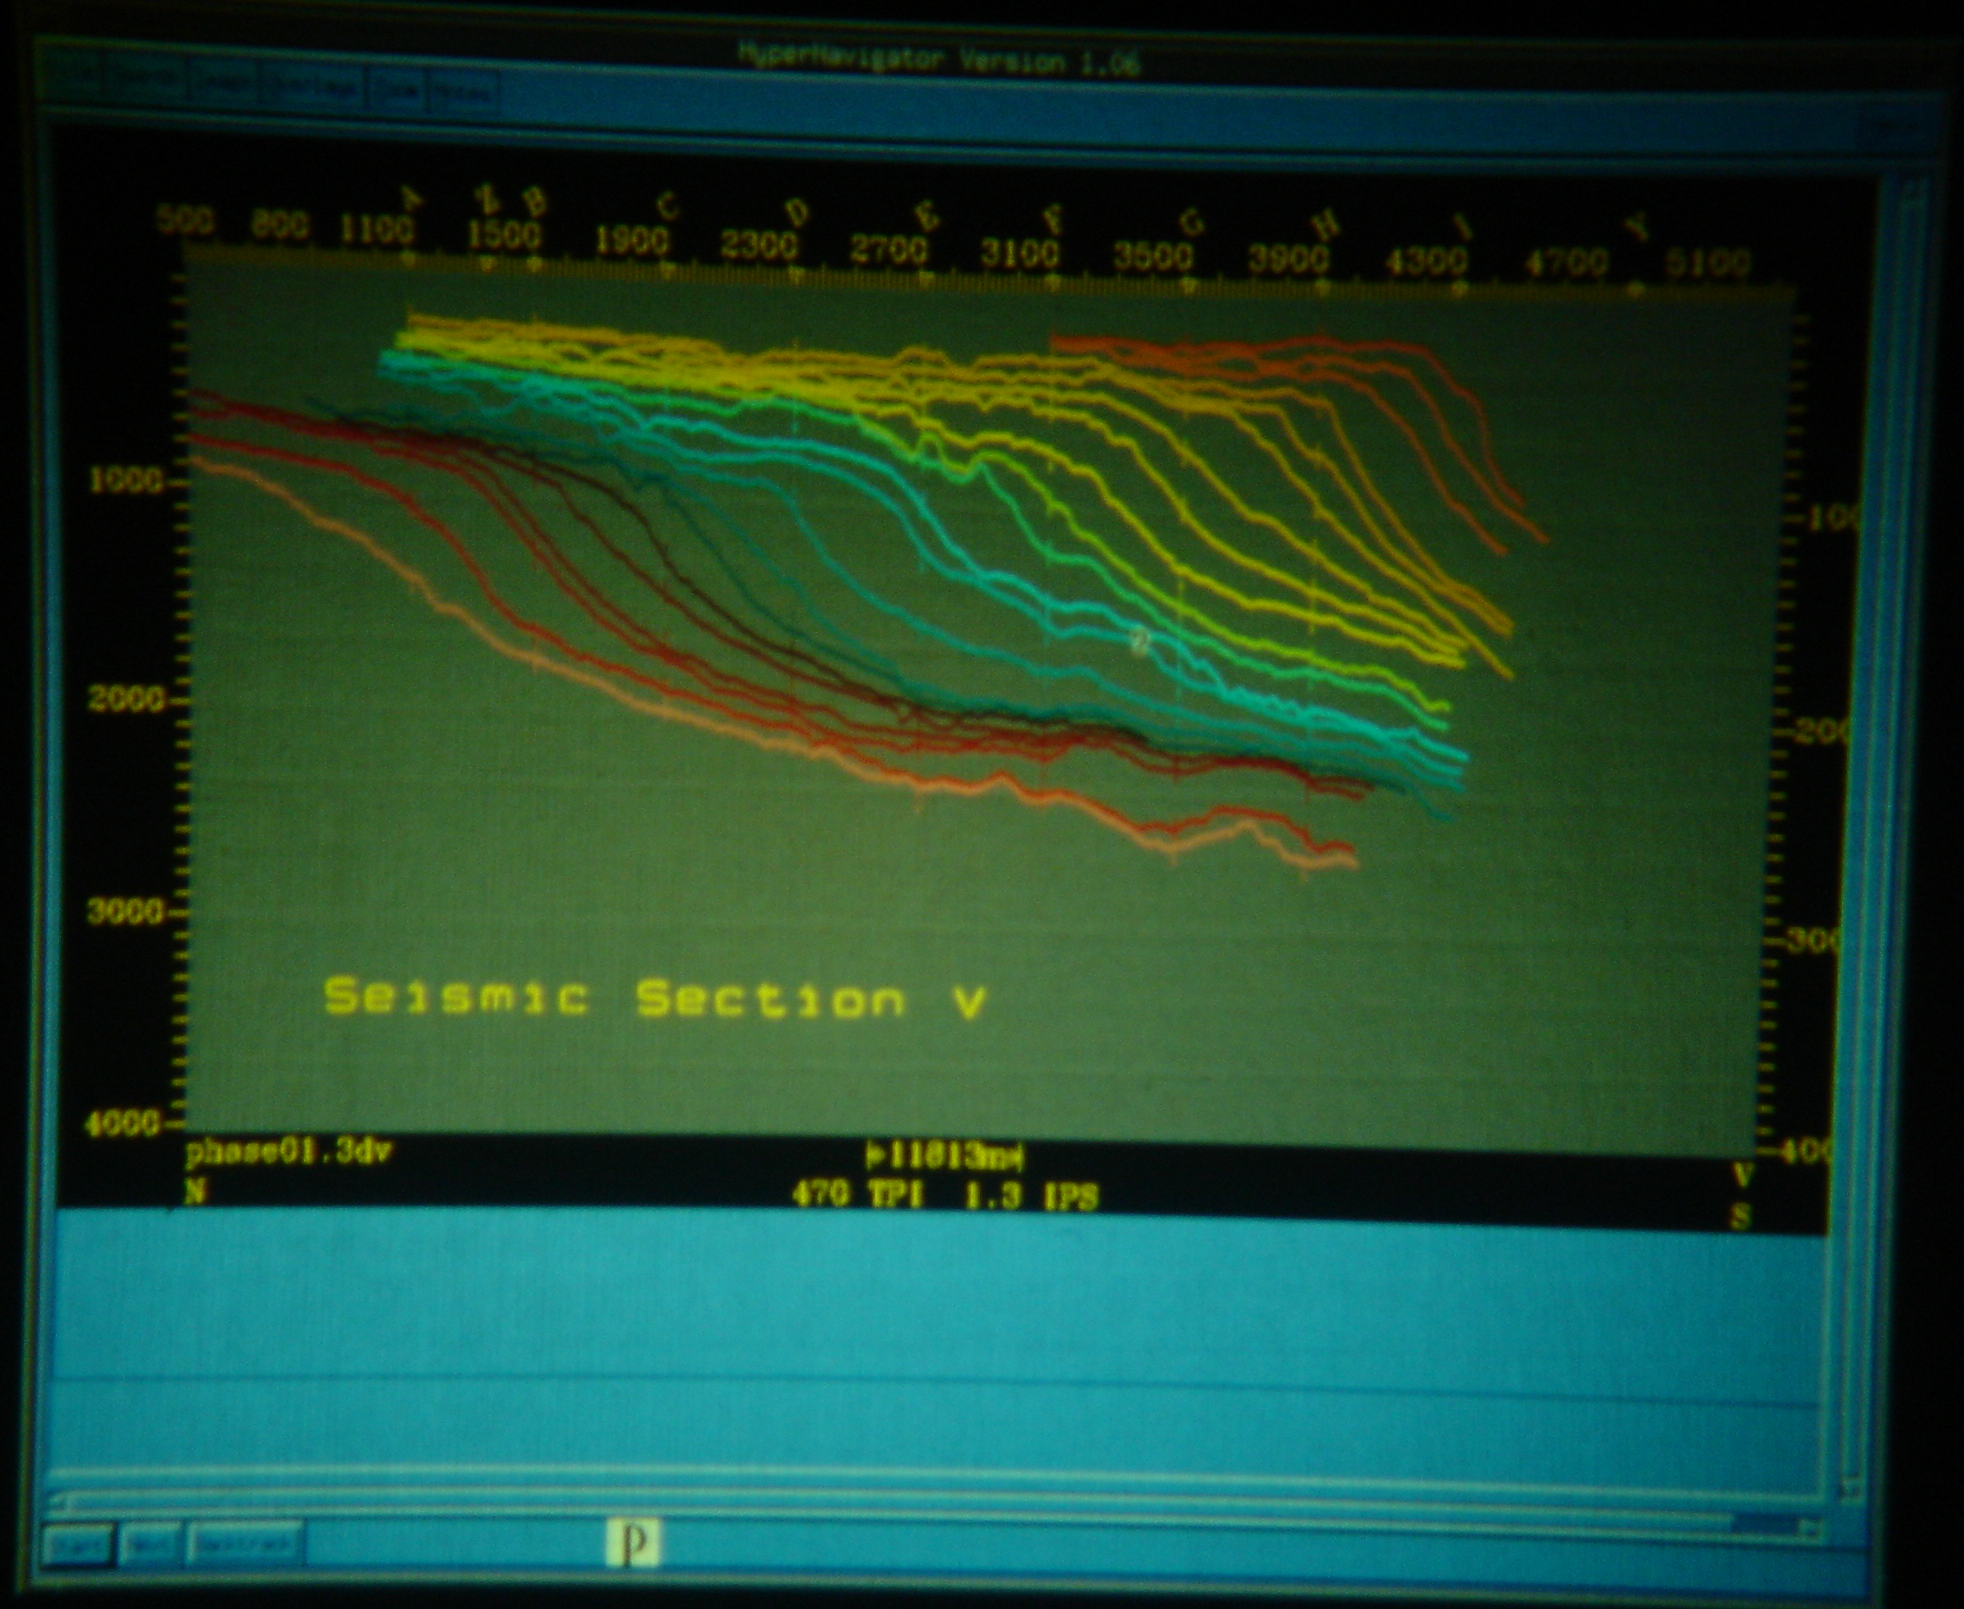
Figure 53C. Seismic section V digitized.
To me the most significant insights came from studying the sediment thickness maps. The vertical axis on the cross-sections (Figure 53C) is two-way seismic travel time, or the time it takes seismic energy to travel from a seismic source (air guns in this case) to a specific geologic boundary (seismic reflector), and then back to the receiver (hydrophones in this case). Given an accurate velocity field or velocity function these two-way travel times can be converted to depth. In this case we had no well data to provide velocity control, and so the work was done in two-way seismic travel time. Subtracting a shallower horizon from a deeper horizon provides a thickness map, normally called an isopach map. However, because we are working in two-way travel time, thickness maps are referred to as isochron maps.
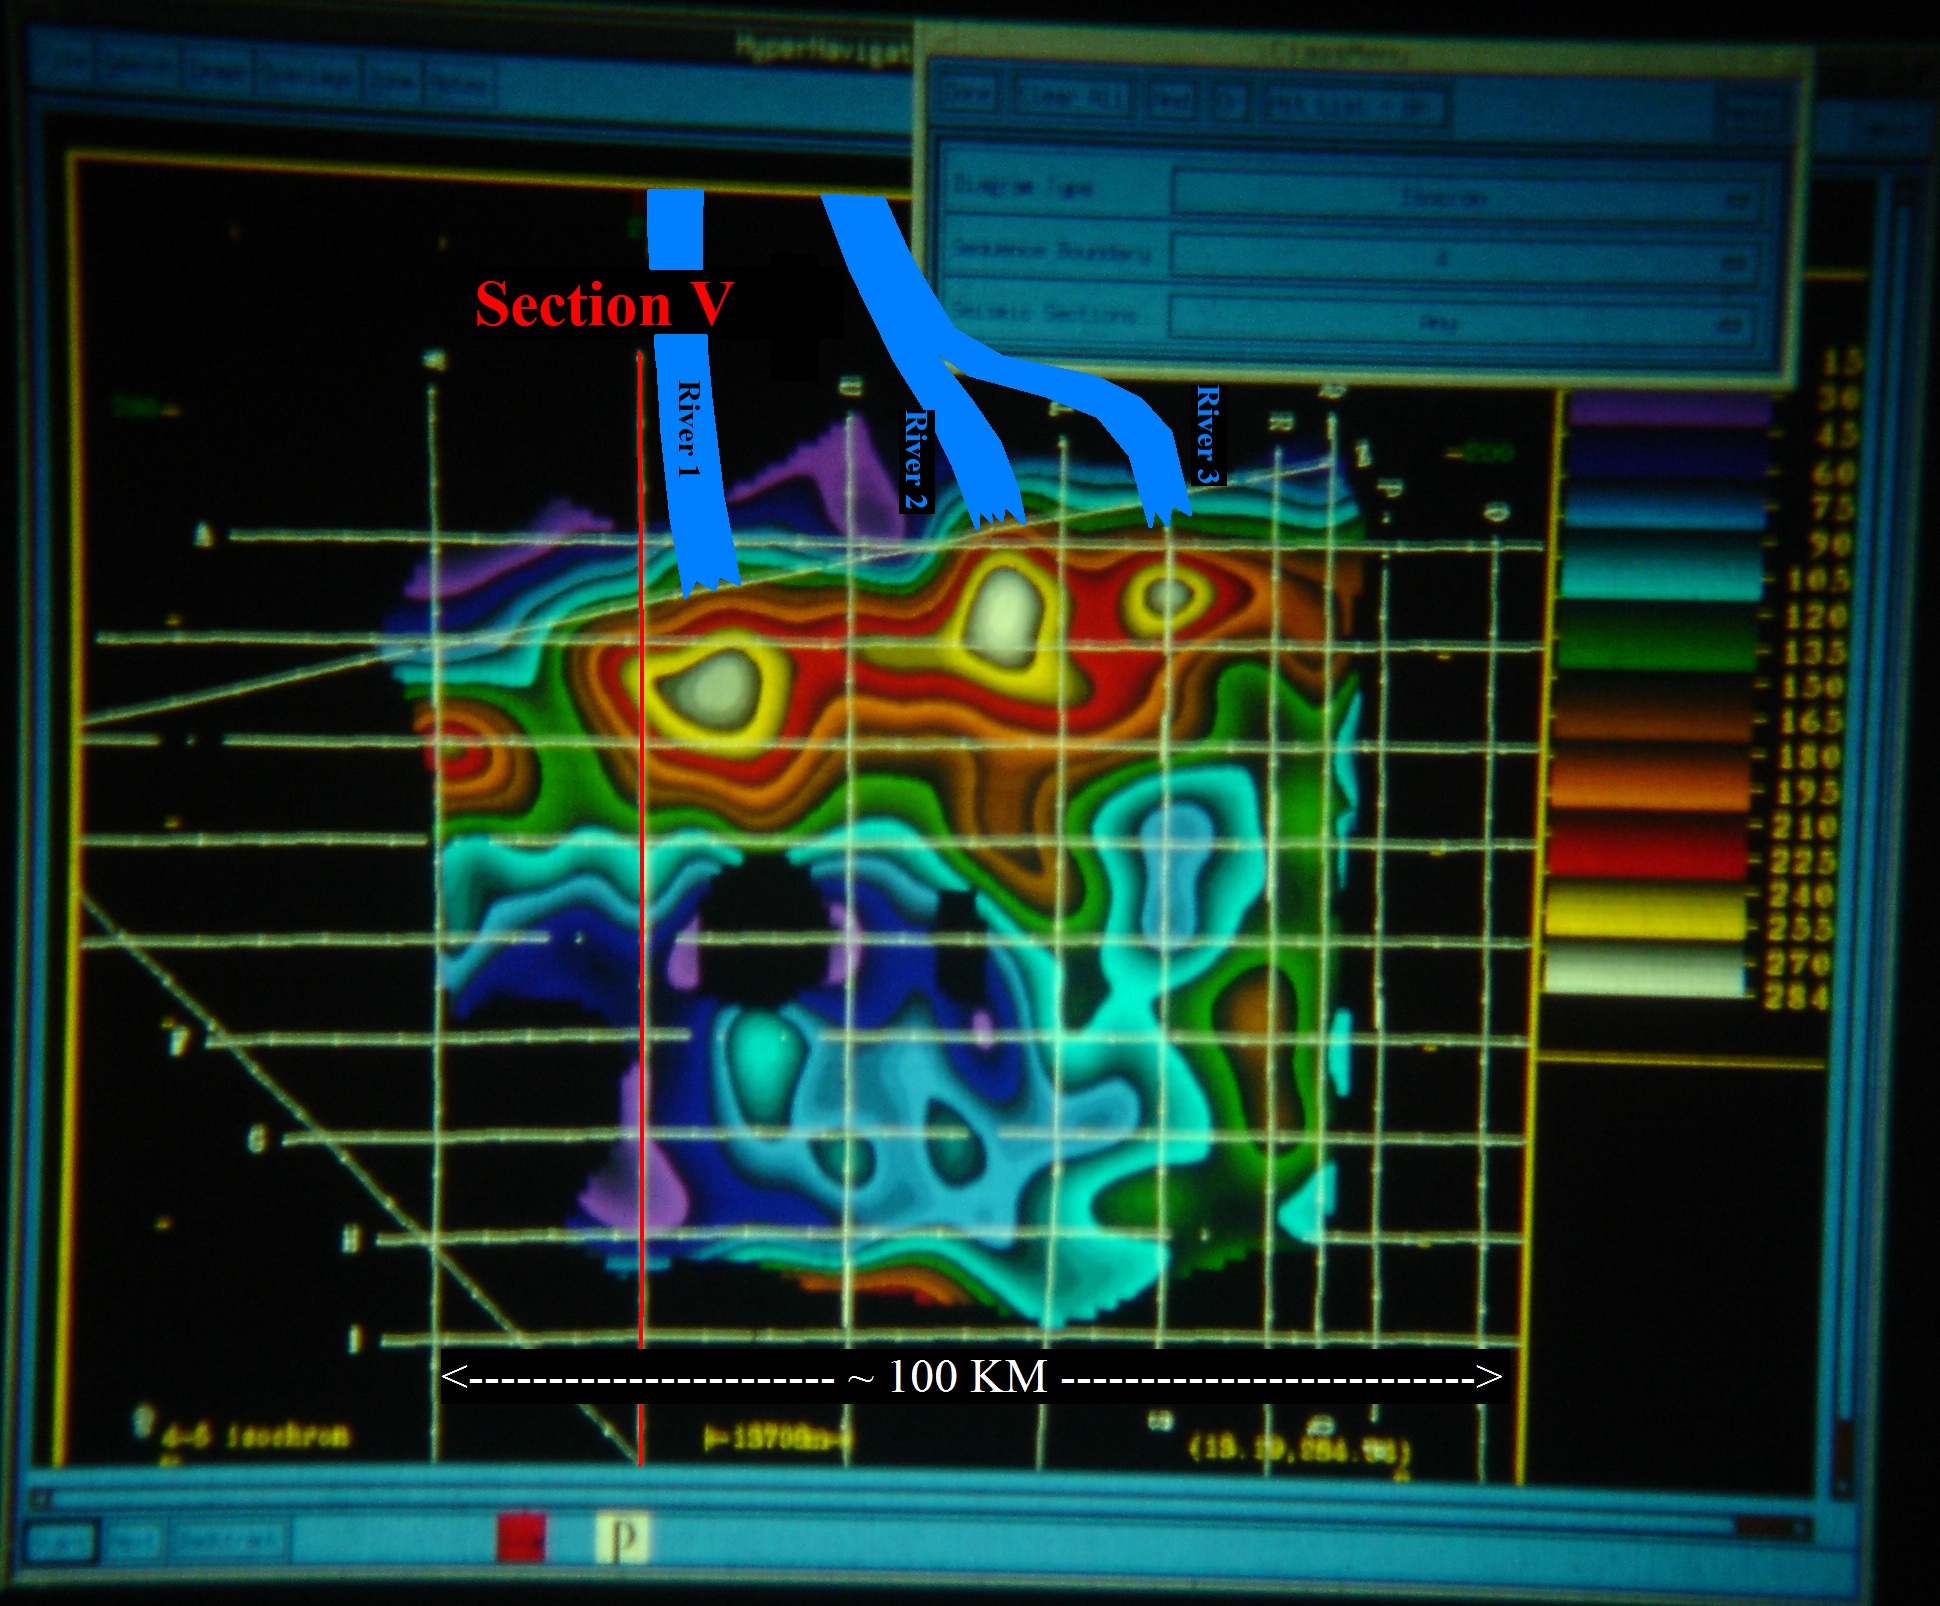
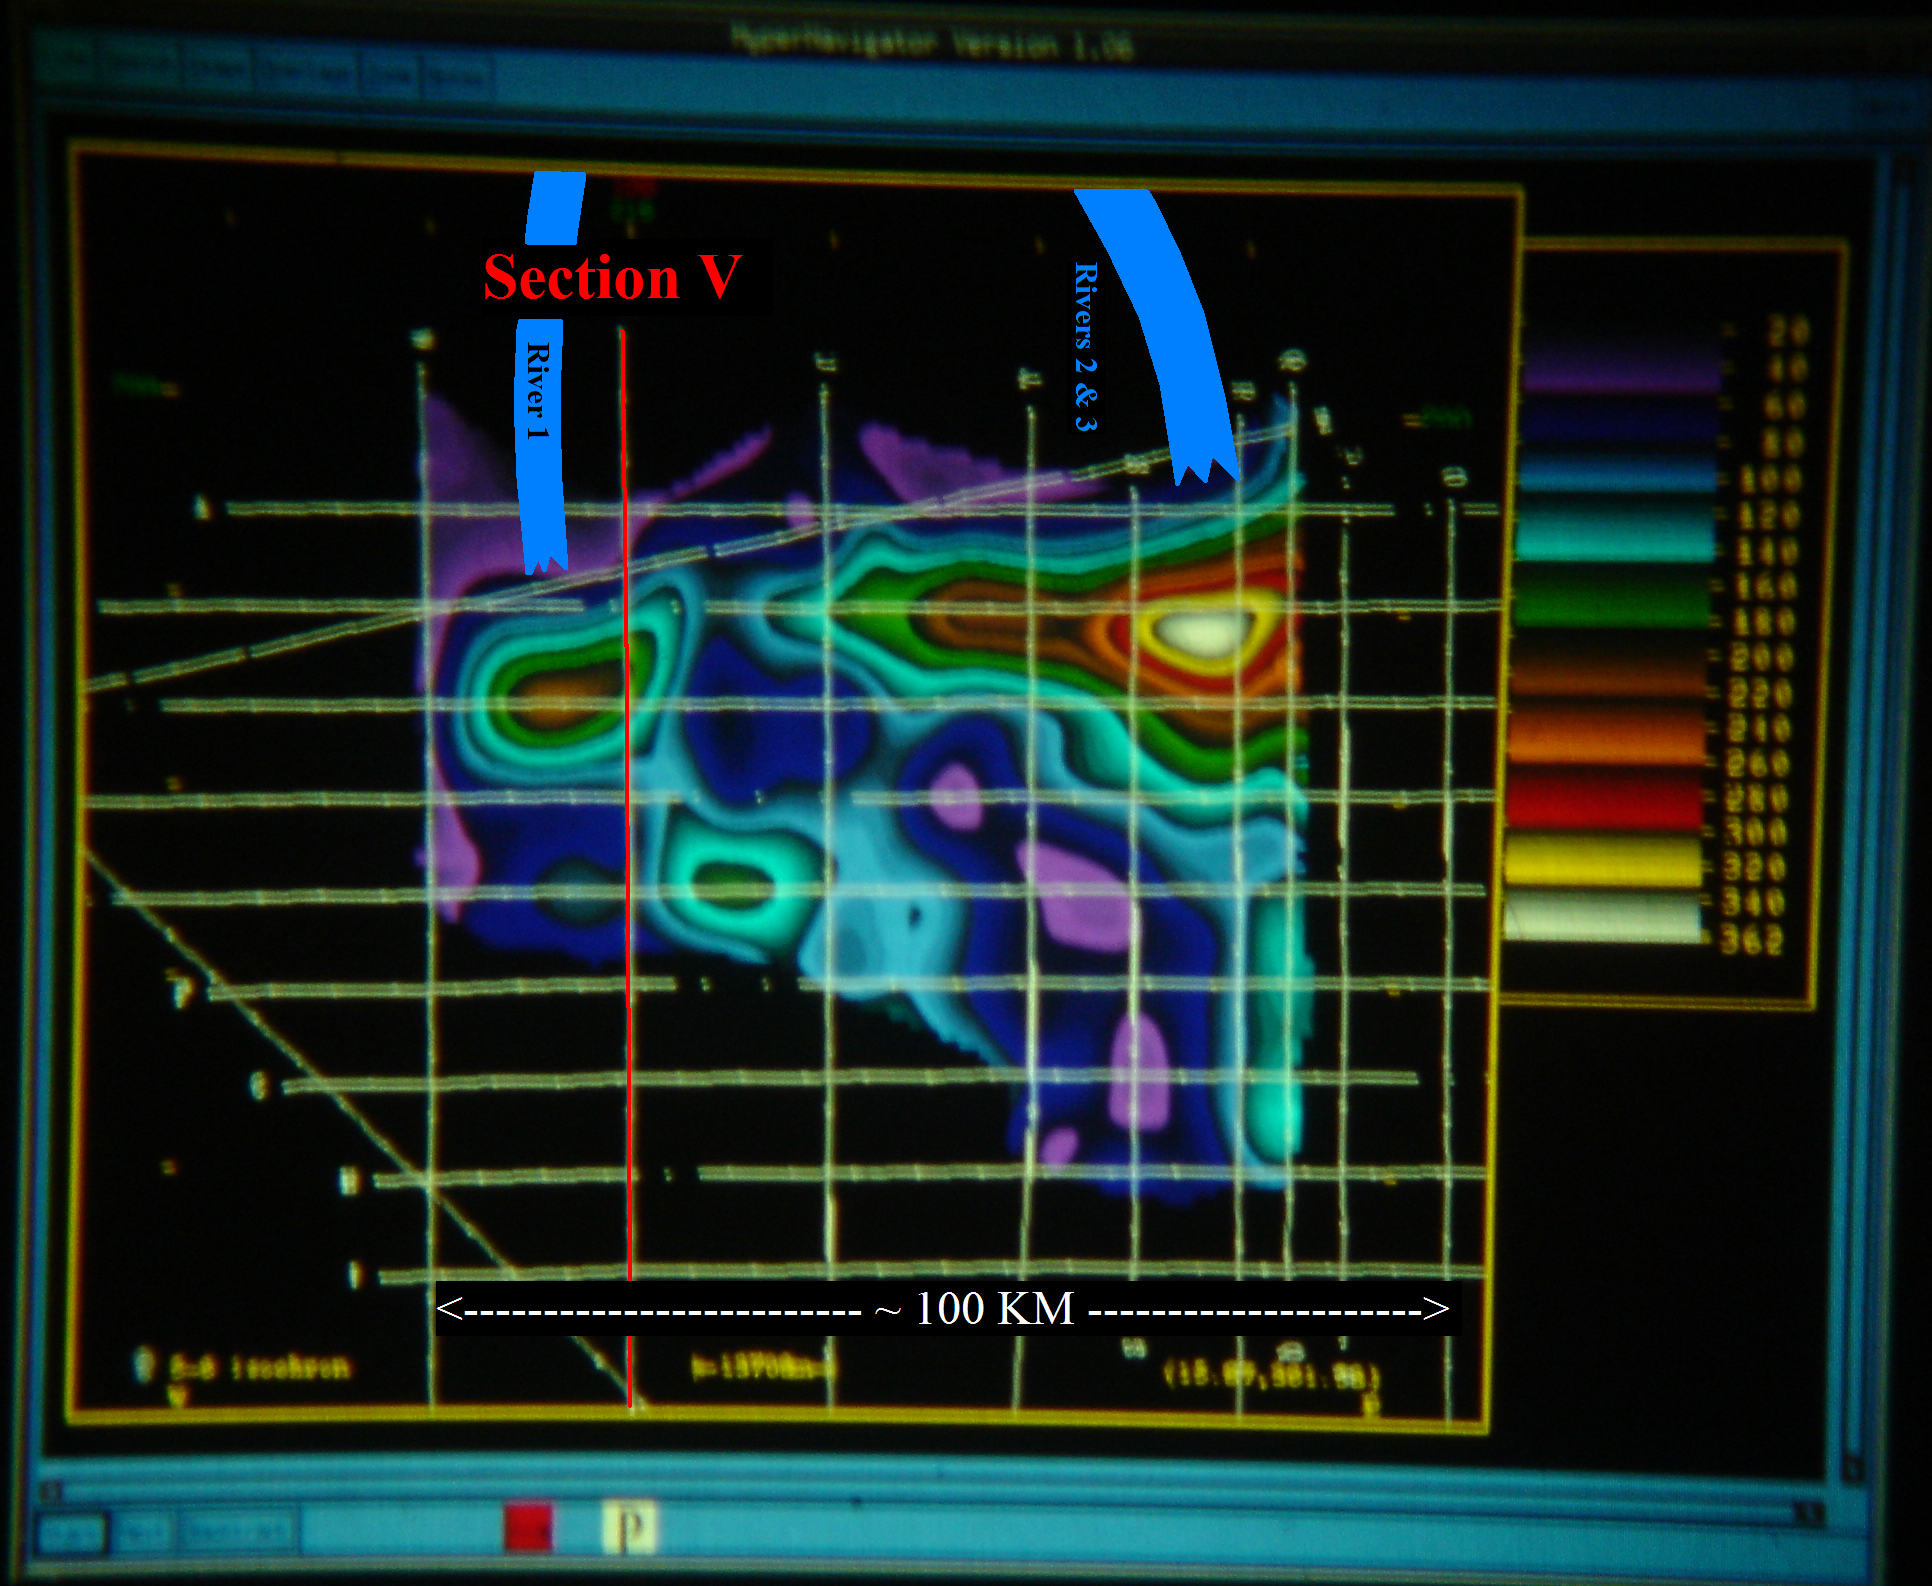
Figure 53D is the isochron (pseudo thickness) map from between Sequence Boundary 4 and Sequence Boundary 5. The thickest mapped sediment pods (yellows and whites) show where the various branches of the ancient Zambezi River were dumping their sediments. Probable paths of branches of the river are shown by the blue cartoon drawn on the map. Figure 53E is the isochron map from between Sequence Boundaries 5 and 6, which represents the next eustatic cycle. Note that because of the thick sediments deposited in the first mapped cycle, the ancient Zambezi River changed where it deposited sediments during this second mapped cycle, to be on either side of where the main deposition had been during the fist mapped cycle.
|