|
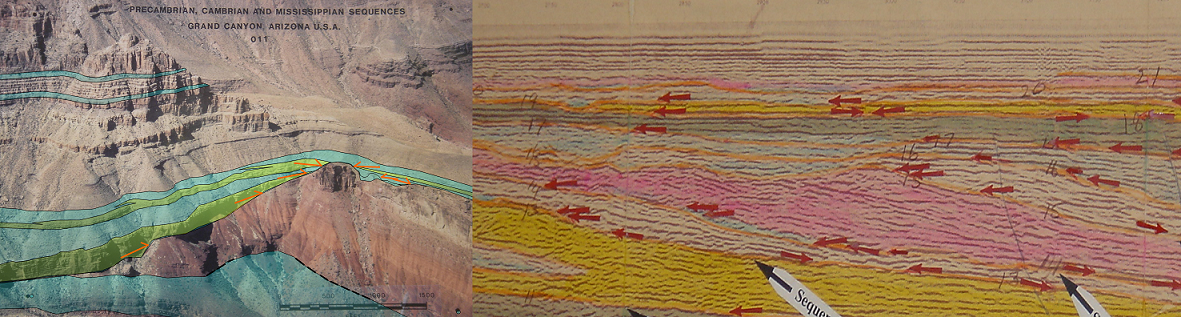
Figure 53B. Zoom on portion of above seismic section V, juxtaposed with an outcrop from the Grand Canyon appended to the left which has similar depositional patterns.
Uniformitarianism contrasts with catastrophism, which states that features on Earth originated suddenly in the past by geological processes radically different than those occurring today.
Although the debate between these two concepts was hard to reconcile with 18th century religious beliefs, most mainstream scientists and religious denominations support uniformitarianism today.
It is interesting to note how many catastrophic events, like the flooding of the Mediterranean Sea, are perfectly compatible with uniformitarianism.3.165
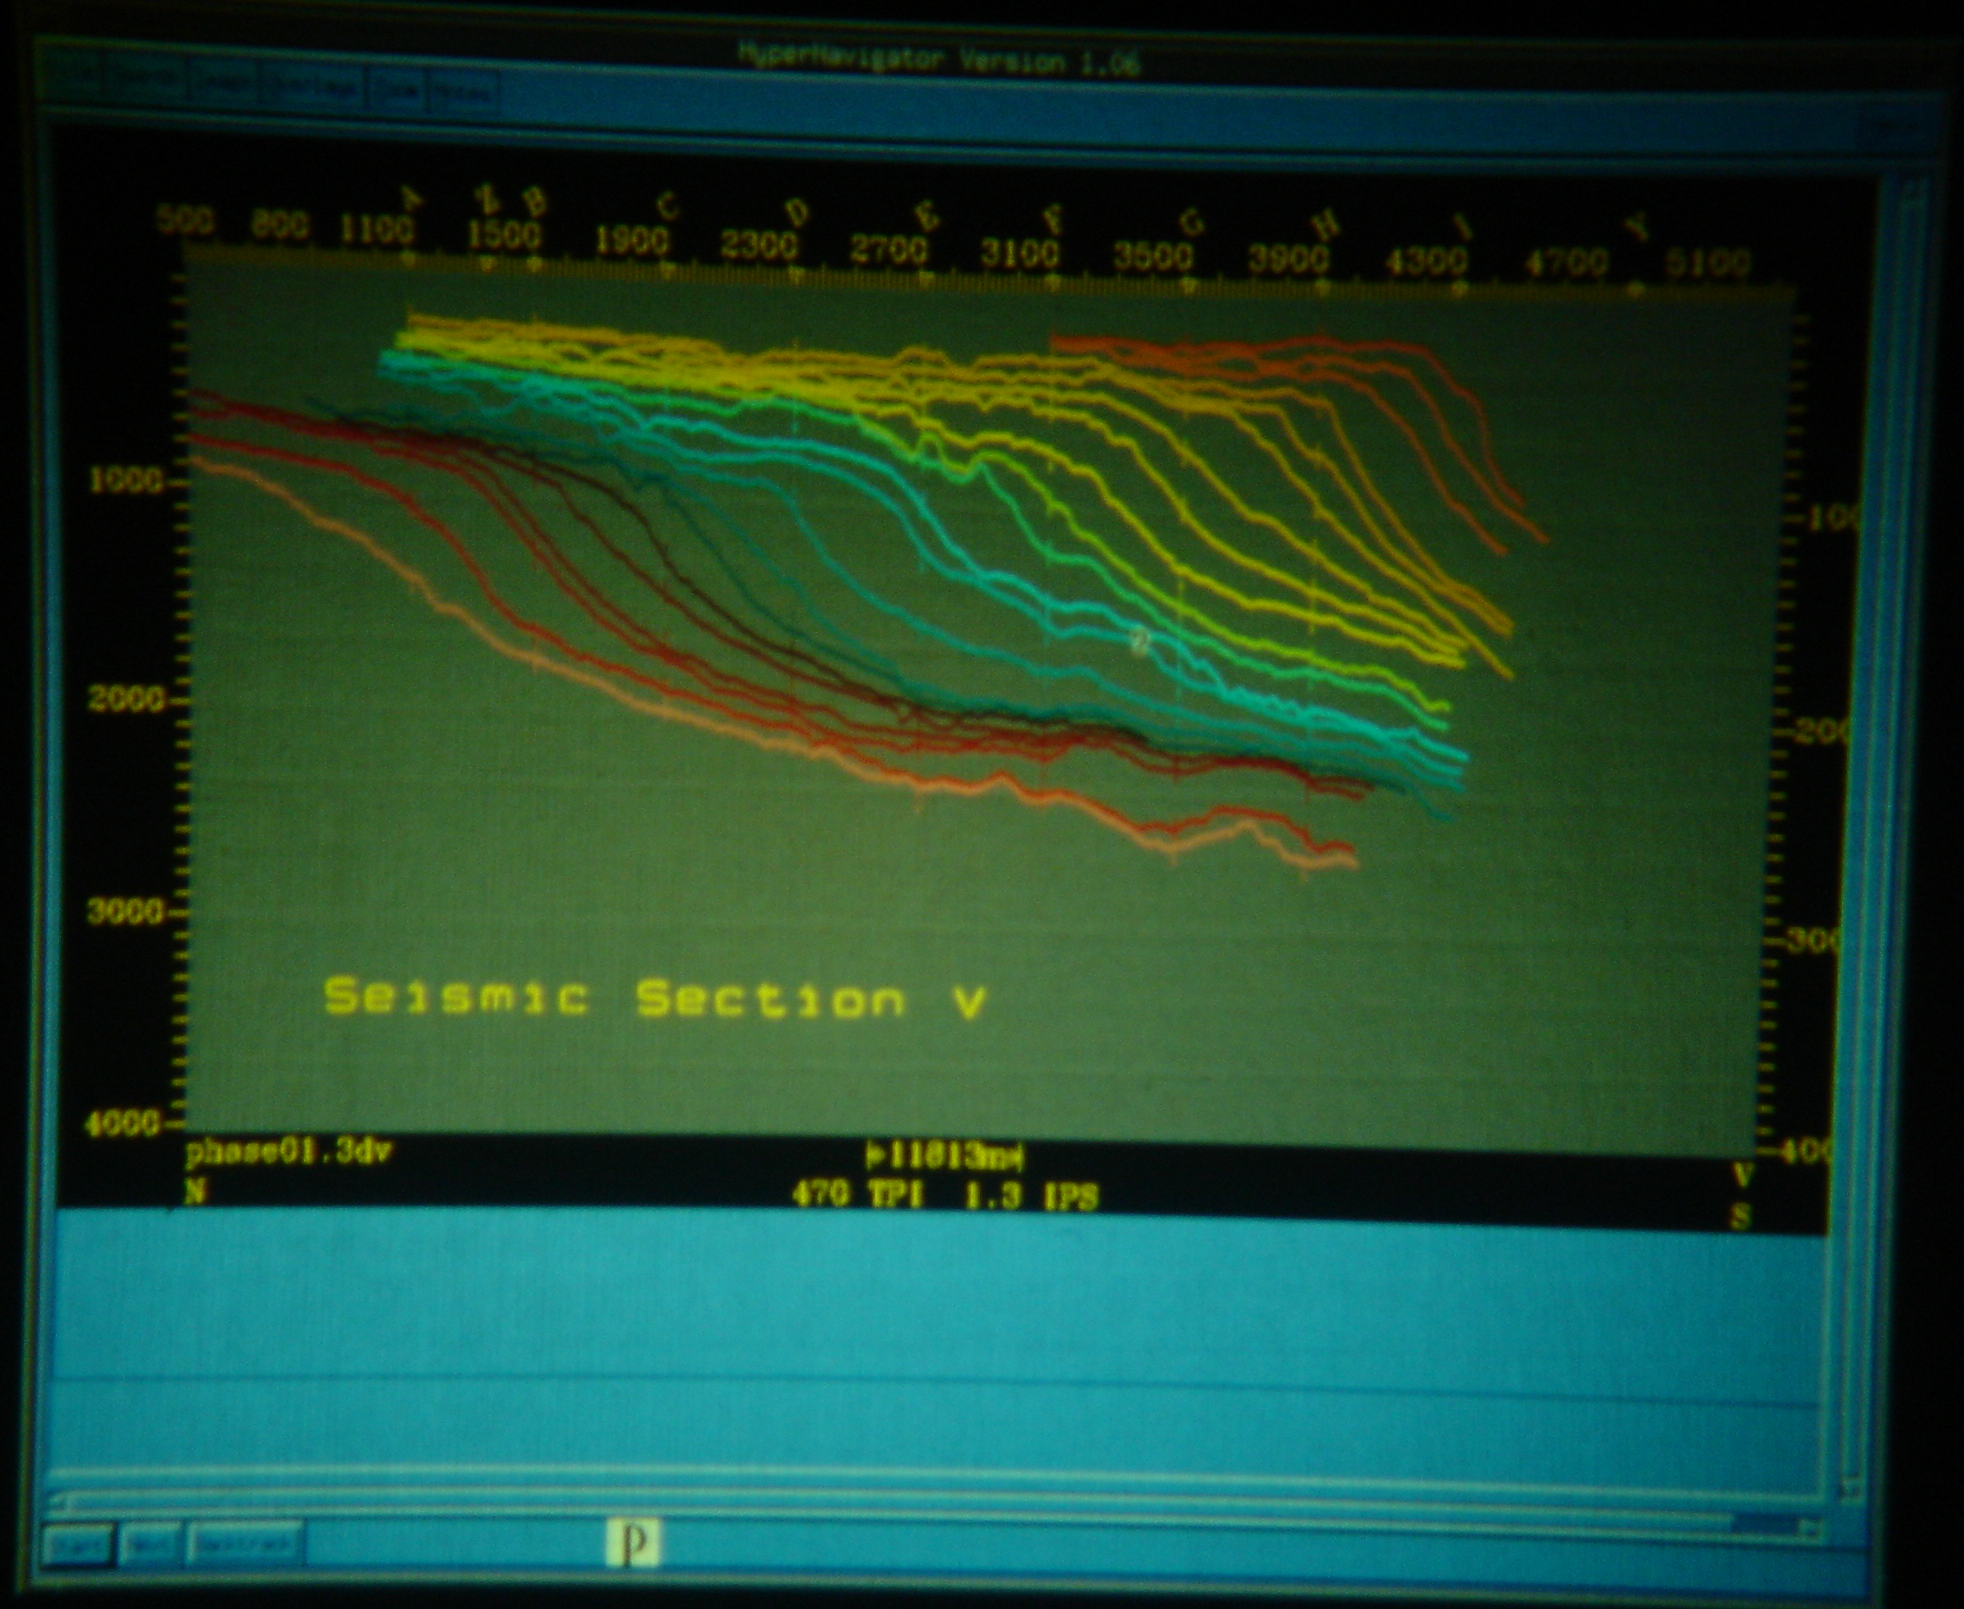
Several parts of this project which were very interesting to me. The interpretation was initially done by Dr. Kolla on 2-dimensional seismic paper sections. This interpretation was one of the first large scale interpretations digitized into an interactive 2-D seismic interpretation workstation. The results of this digitization of line V is shown in Figure 53C. Having these horizons digitized allowed us to look at horizons attributes in a new way. Although I won't go into all of the details here, I will summarize some insights gained from this study. Shrinking the interpretation to fit on a monitor gave a new visual understanding of how sediments had prograded out from the Zambezi River. It is easy to recognize the thin shelf, thicker slope, and thin deep water deposits. These deposits grew across geologic time, similar to how tree rings grow. The first step was to study the isochron maps, or seismic travel-time thickness maps calculated by subtracting a horizon from it's next deeper horizon. These calculation results will be discussed below. We were also able to calculate the dip and azimuth of each of the horizons. When we calculated the dip of the dip of the horizons, the results showed the strongest changes in the dip of the horizons. These maps allowed us to automatically identify the shelf break for each horizon, and to predict where sand deposition from beaches stopped and where shale deposition started. This also allowed us to semi-automatically predict lithology distributions on the sections. It was a fascinating geological study.
|
