|
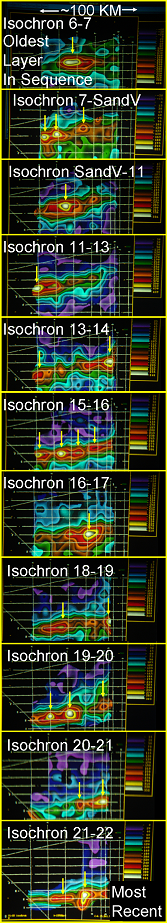
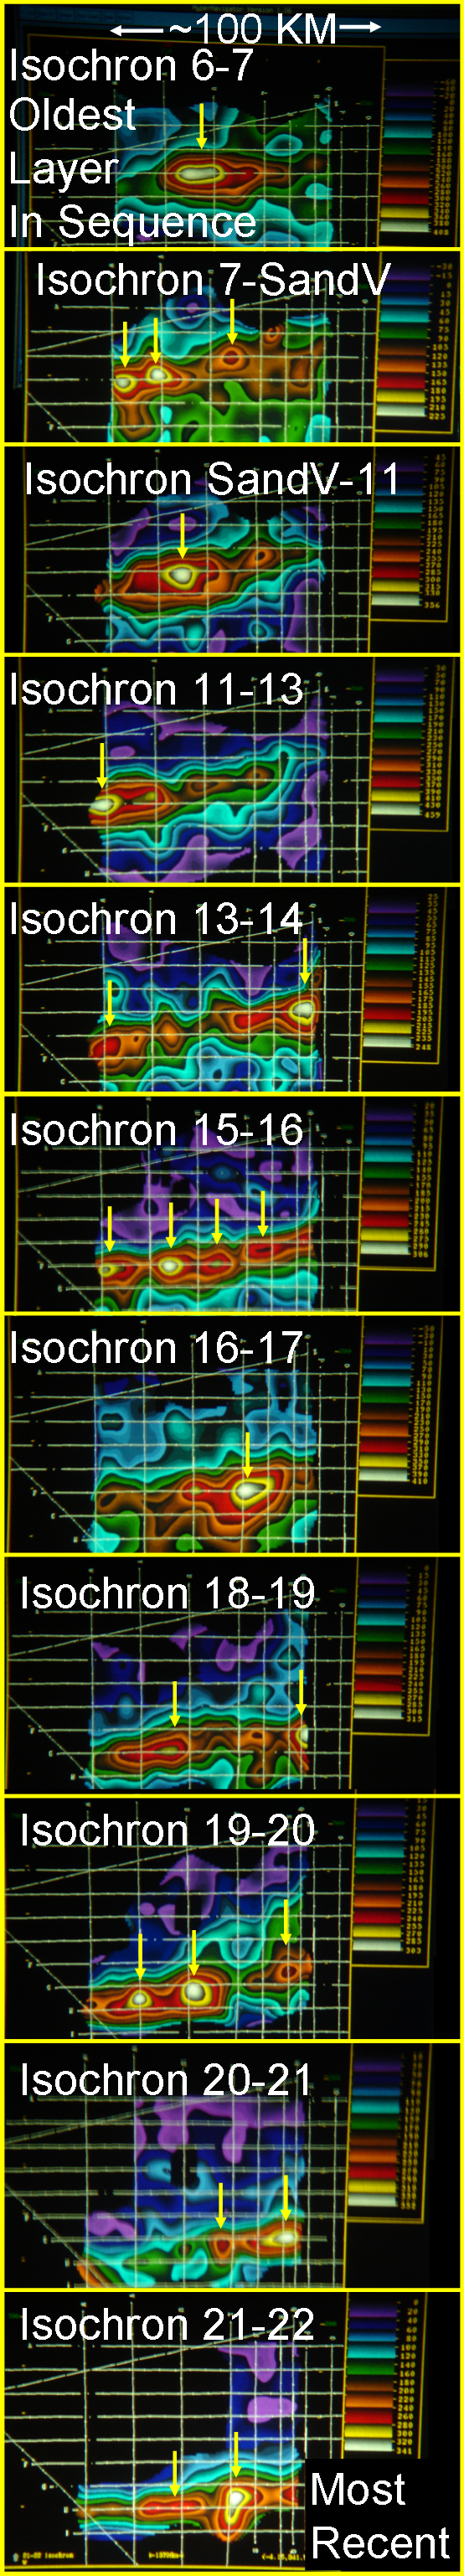
This same feedback change in depositional centers was repeated for each of the next eleven (11) thickness intervals, as illustrated in Figure 53F. Instead of drawing in a cartoon of where the river channels moved to, a yellow arrow was placed pointing to each of the thickest sediment packages. The oldest, or deepest layer thickness map is at the top, and the most recent layer thickness map is at the bottom. The lateral shifting of the the river to respond to depositional lows at each new eustatic cycle repeats consistently across this long geological time.
The Mozambique example demonstrates the natural process by which sediments are laid down on top of thick evaporate layers, creating the weight that liquefies the salt, resulting in the movement which creates salt pillows and salt domes. This example also nicely demonstrates the physical basis geologists have for saying the earth is millions of years old. It is a much more comprehensive example than Yellowstone Lake (Figures 2 and 3).
Figure 53F. Composite isochron thickness maps across eleven (11) eustatic (sea level change) intervals. |
 |
|